bioGraphic
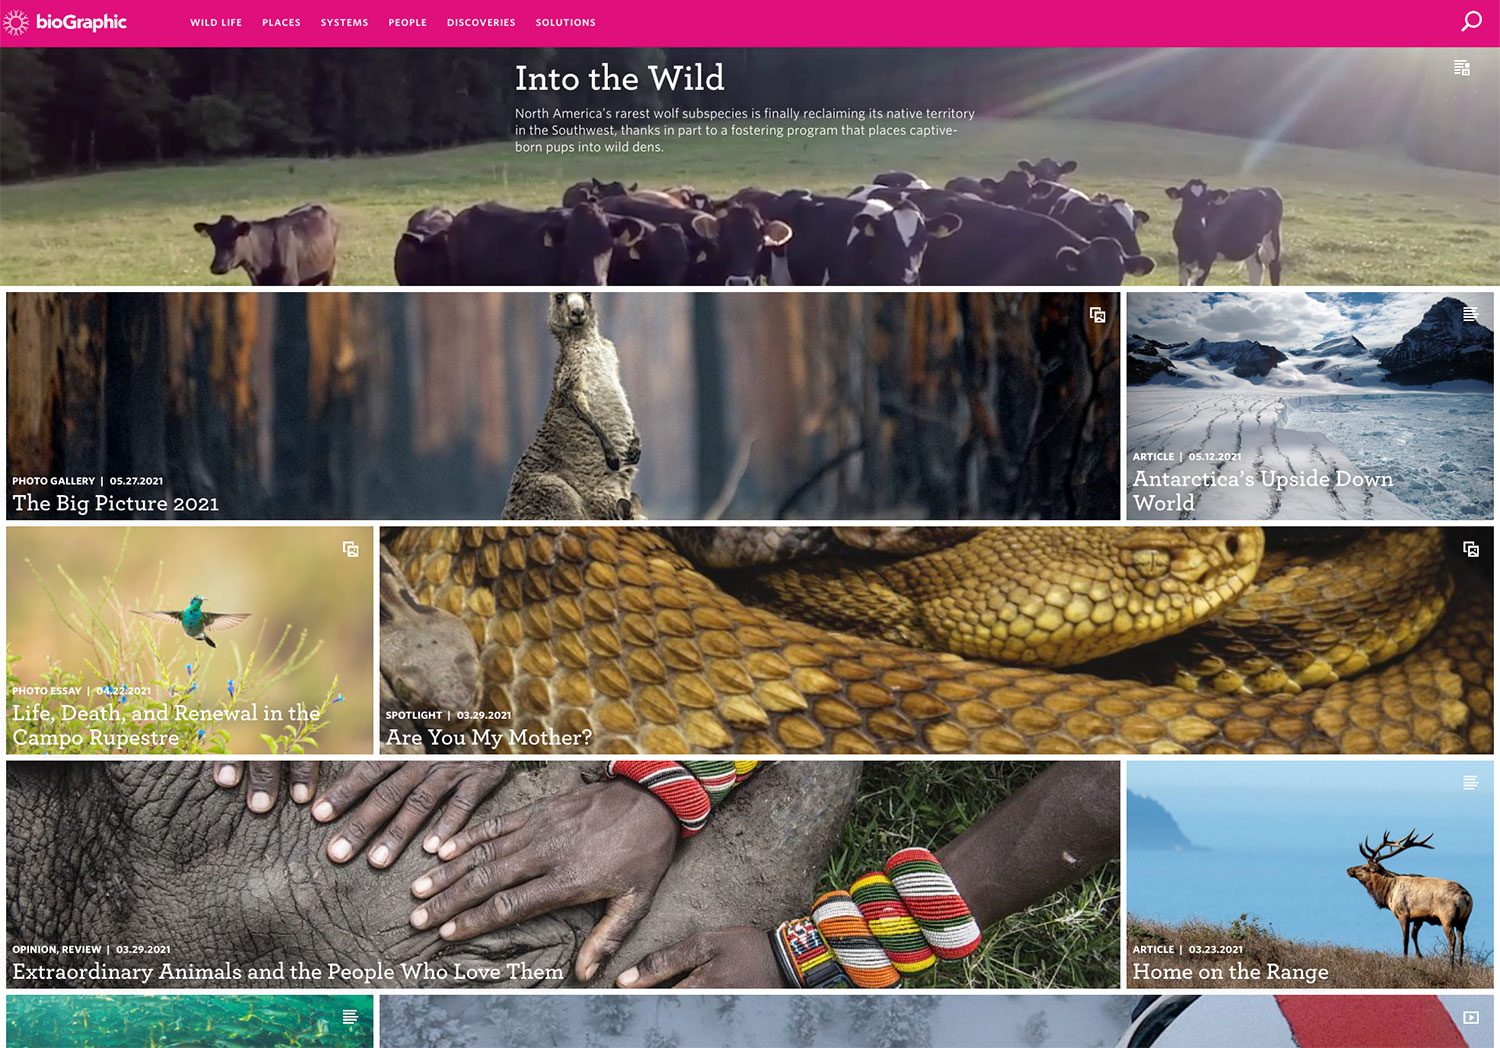
A science publication from the California Academy of Sciences, and the publishing system I designed and built so editors could make distinctive, immersive stories on their own.
I joined bioGraphic in 2015 as the project's lead designer. I led the information architecture, interaction design, visual system and reader testing, and I was the primary front-end developer from the first version through the 2018 rebuild. I also designed the information graphics inside the stories, from charts and maps to flows and timelines.
Day to day I worked with a small editorial team, commissioned writers and photographers, Academy scientists and external developers. Three editors used the system regularly.
Designing the stories we had wasn't really the job. We needed a system flexible enough for stories nobody had written yet, and simple enough that editors could run it without me. A few things pulled against each other:
- Long and richHeavy media, but readable on a phone.
- DistinctEvery story needed to feel like its own piece.
- Public audienceGeneral readers, not a technical readership.
- Editor-runEditors and writers had to run it themselves.
The system outlasted my time at the Academy
It carried the publication from nearly 150 stories to more than 600, on the same structure.
- 600+
- stories on the same system by July 2026
- 1M+
- people reached a year,
per bioGraphic - 8 yrs
- on the 2018 build
- 25+
- named sections for
building any story
How it came together
From the first content model in 2015 to an archive editors ran on their own.
Structure before layout
Readers and editors looked at the same stories in different ways, so I built two taxonomies. Subject was for browsing, and format also told the system which template to use.
Two ways into the same stories
Before any layout work, the stories needed a structure. Readers tend to browse by interest, while editors think in formats.
Two taxonomies that work together
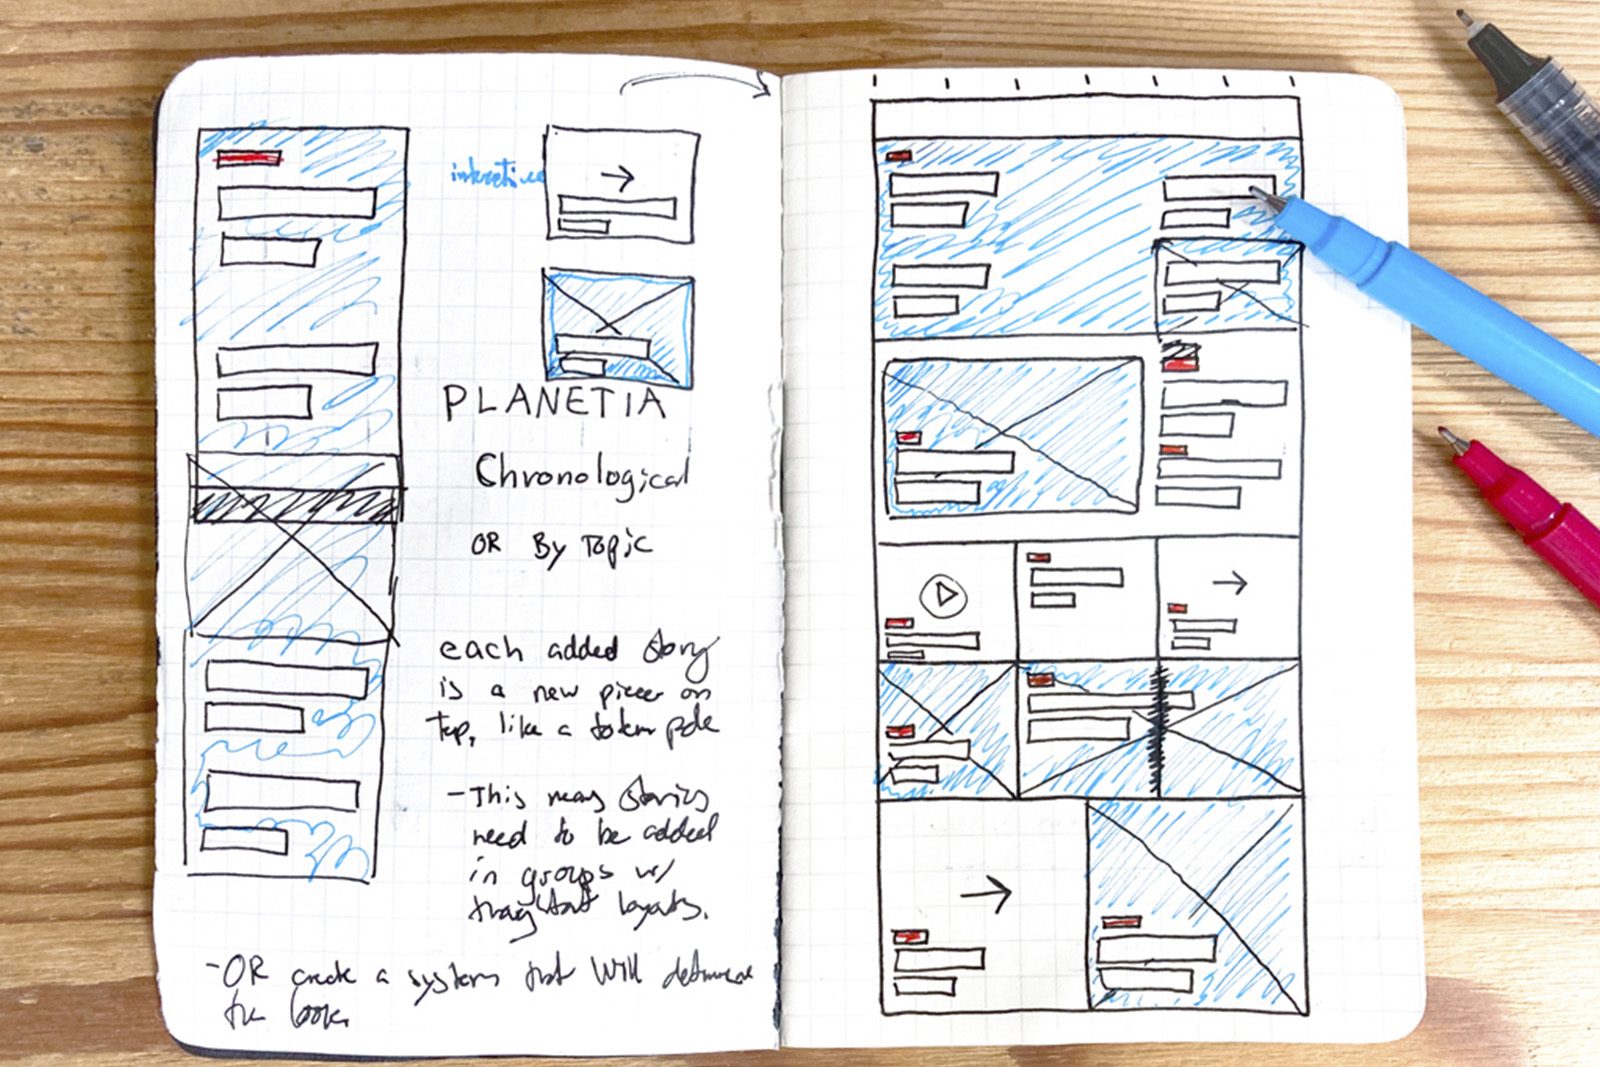
Subject (Wild Life, Places, Systems, People, Discoveries, Solutions) let readers explore by topic. Format (Immersive, Articles, Videos, Photos, Opinions) gave another way in, and told the system which template to use, so a story's layout came with its tag.
A homepage editors could arrange
Ordering by date would have forced stories to arrive in coordinated groups. An editor-arranged homepage let the publication grow without tying releases to a fixed layout.
Testing kept reshaping it
Later rounds of testing showed readers weren't using the secondary navigation the way we'd expected, so we removed it and adjusted the primary taxonomy. That meant retagging every affected story, so each one still fit the new structure and suggested stories still lined up.

A system that doesn't make every story feel the same
We needed a system editors could use on their own, without every story looking the same. Reusable layouts gave them a starting point, and the photography, video and choice of sections made each story feel different.
Modules that fill in from story metadata
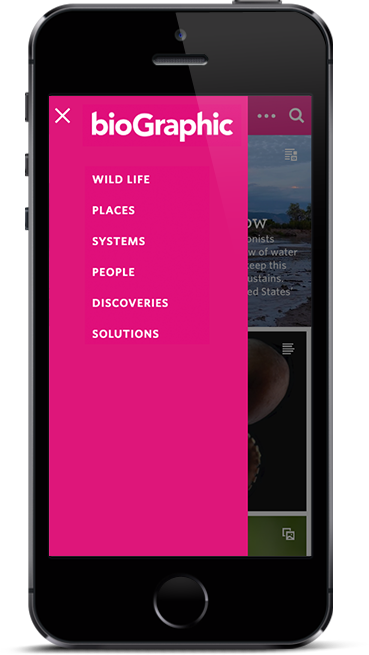
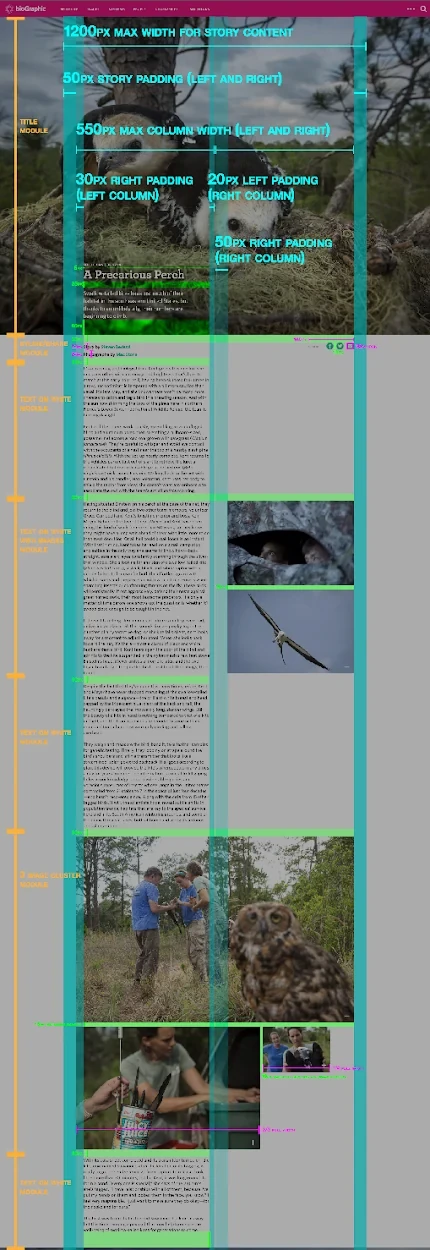
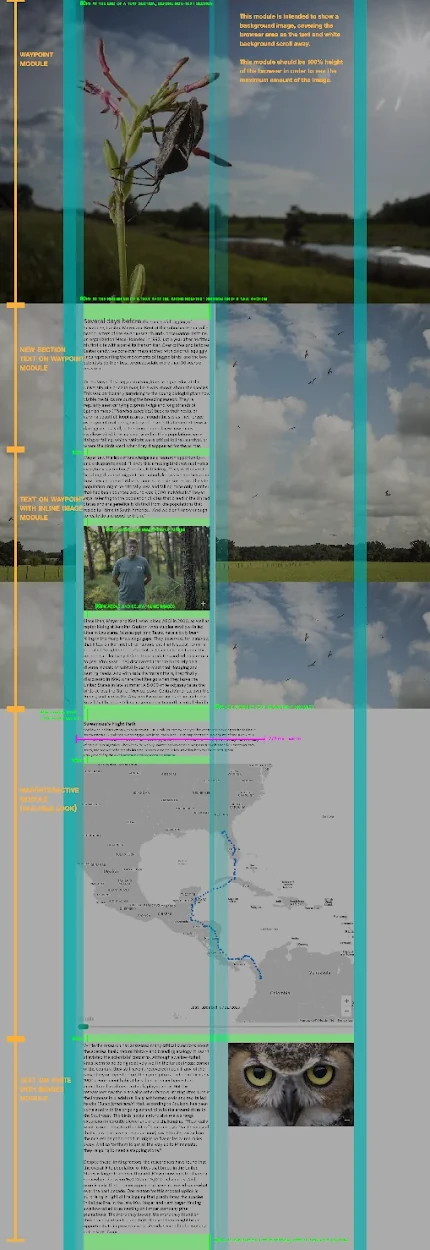
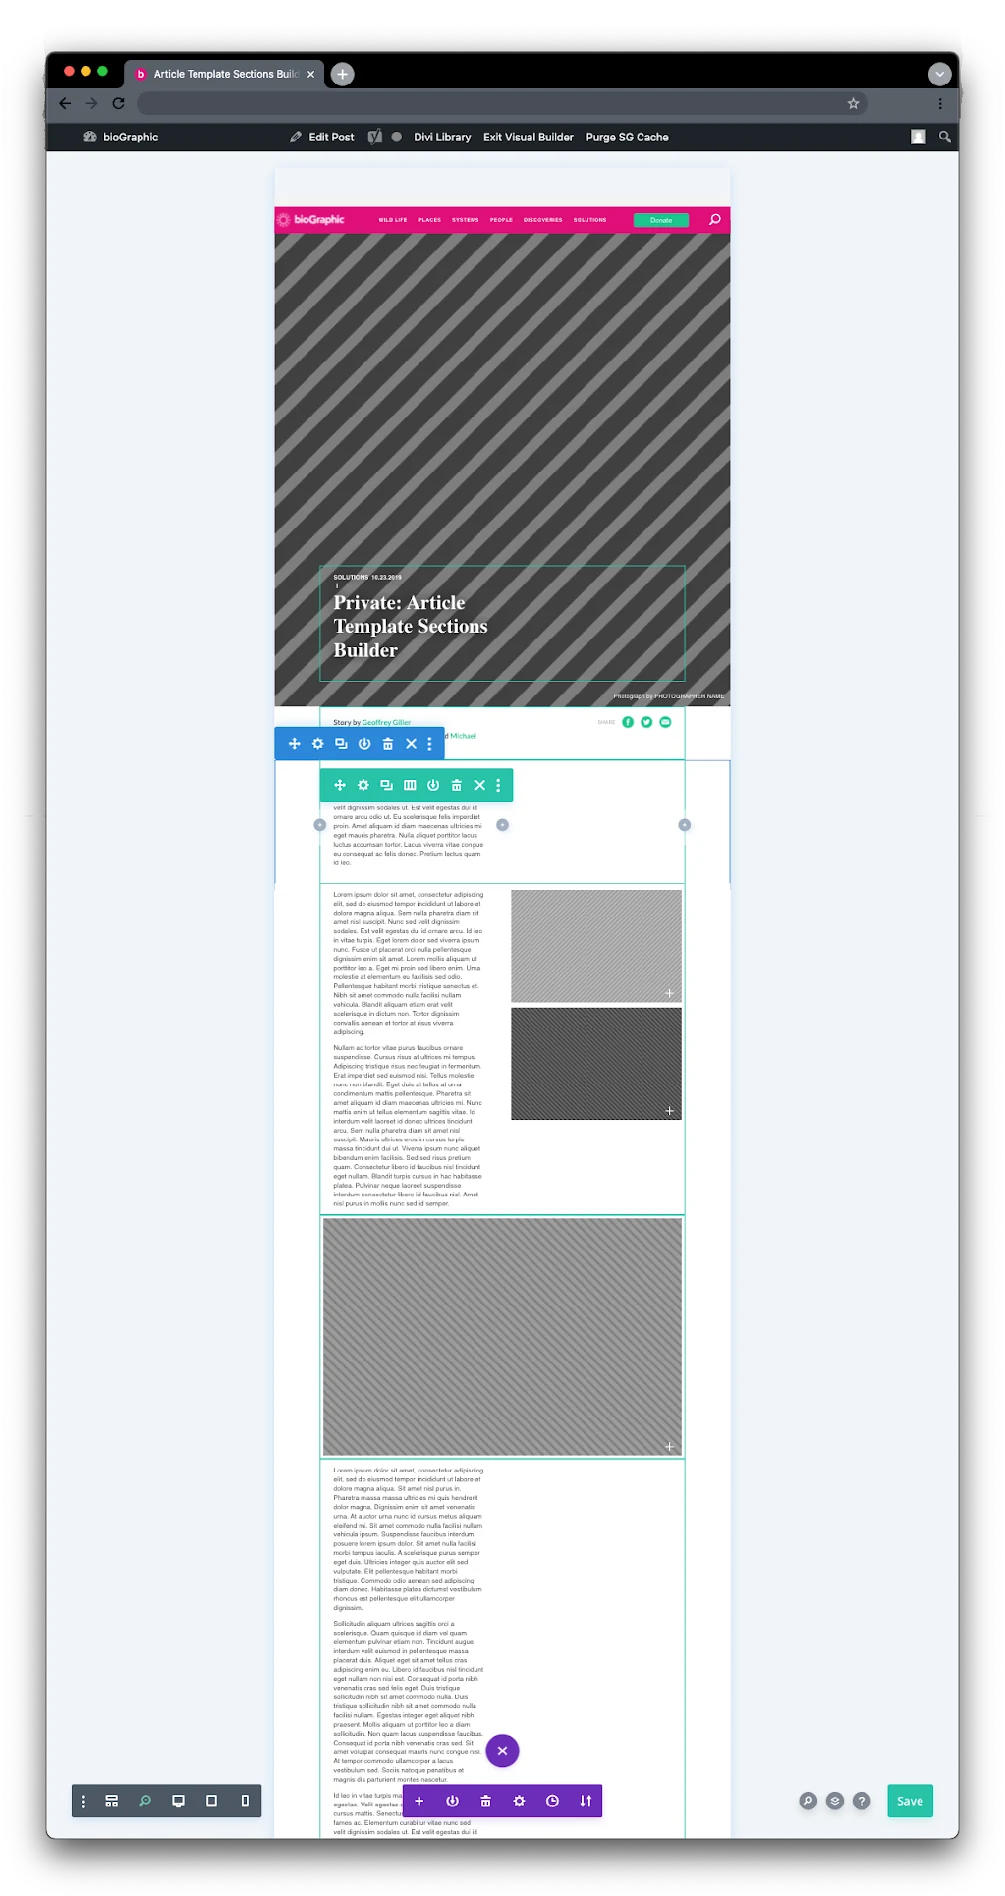
Stories stack from modules, with author, date, category and excerpt pulled from structured fields. I specified sharing, text structure and the lightbox as part of the grid, and sized everything in units so it restacked cleanly on phones.
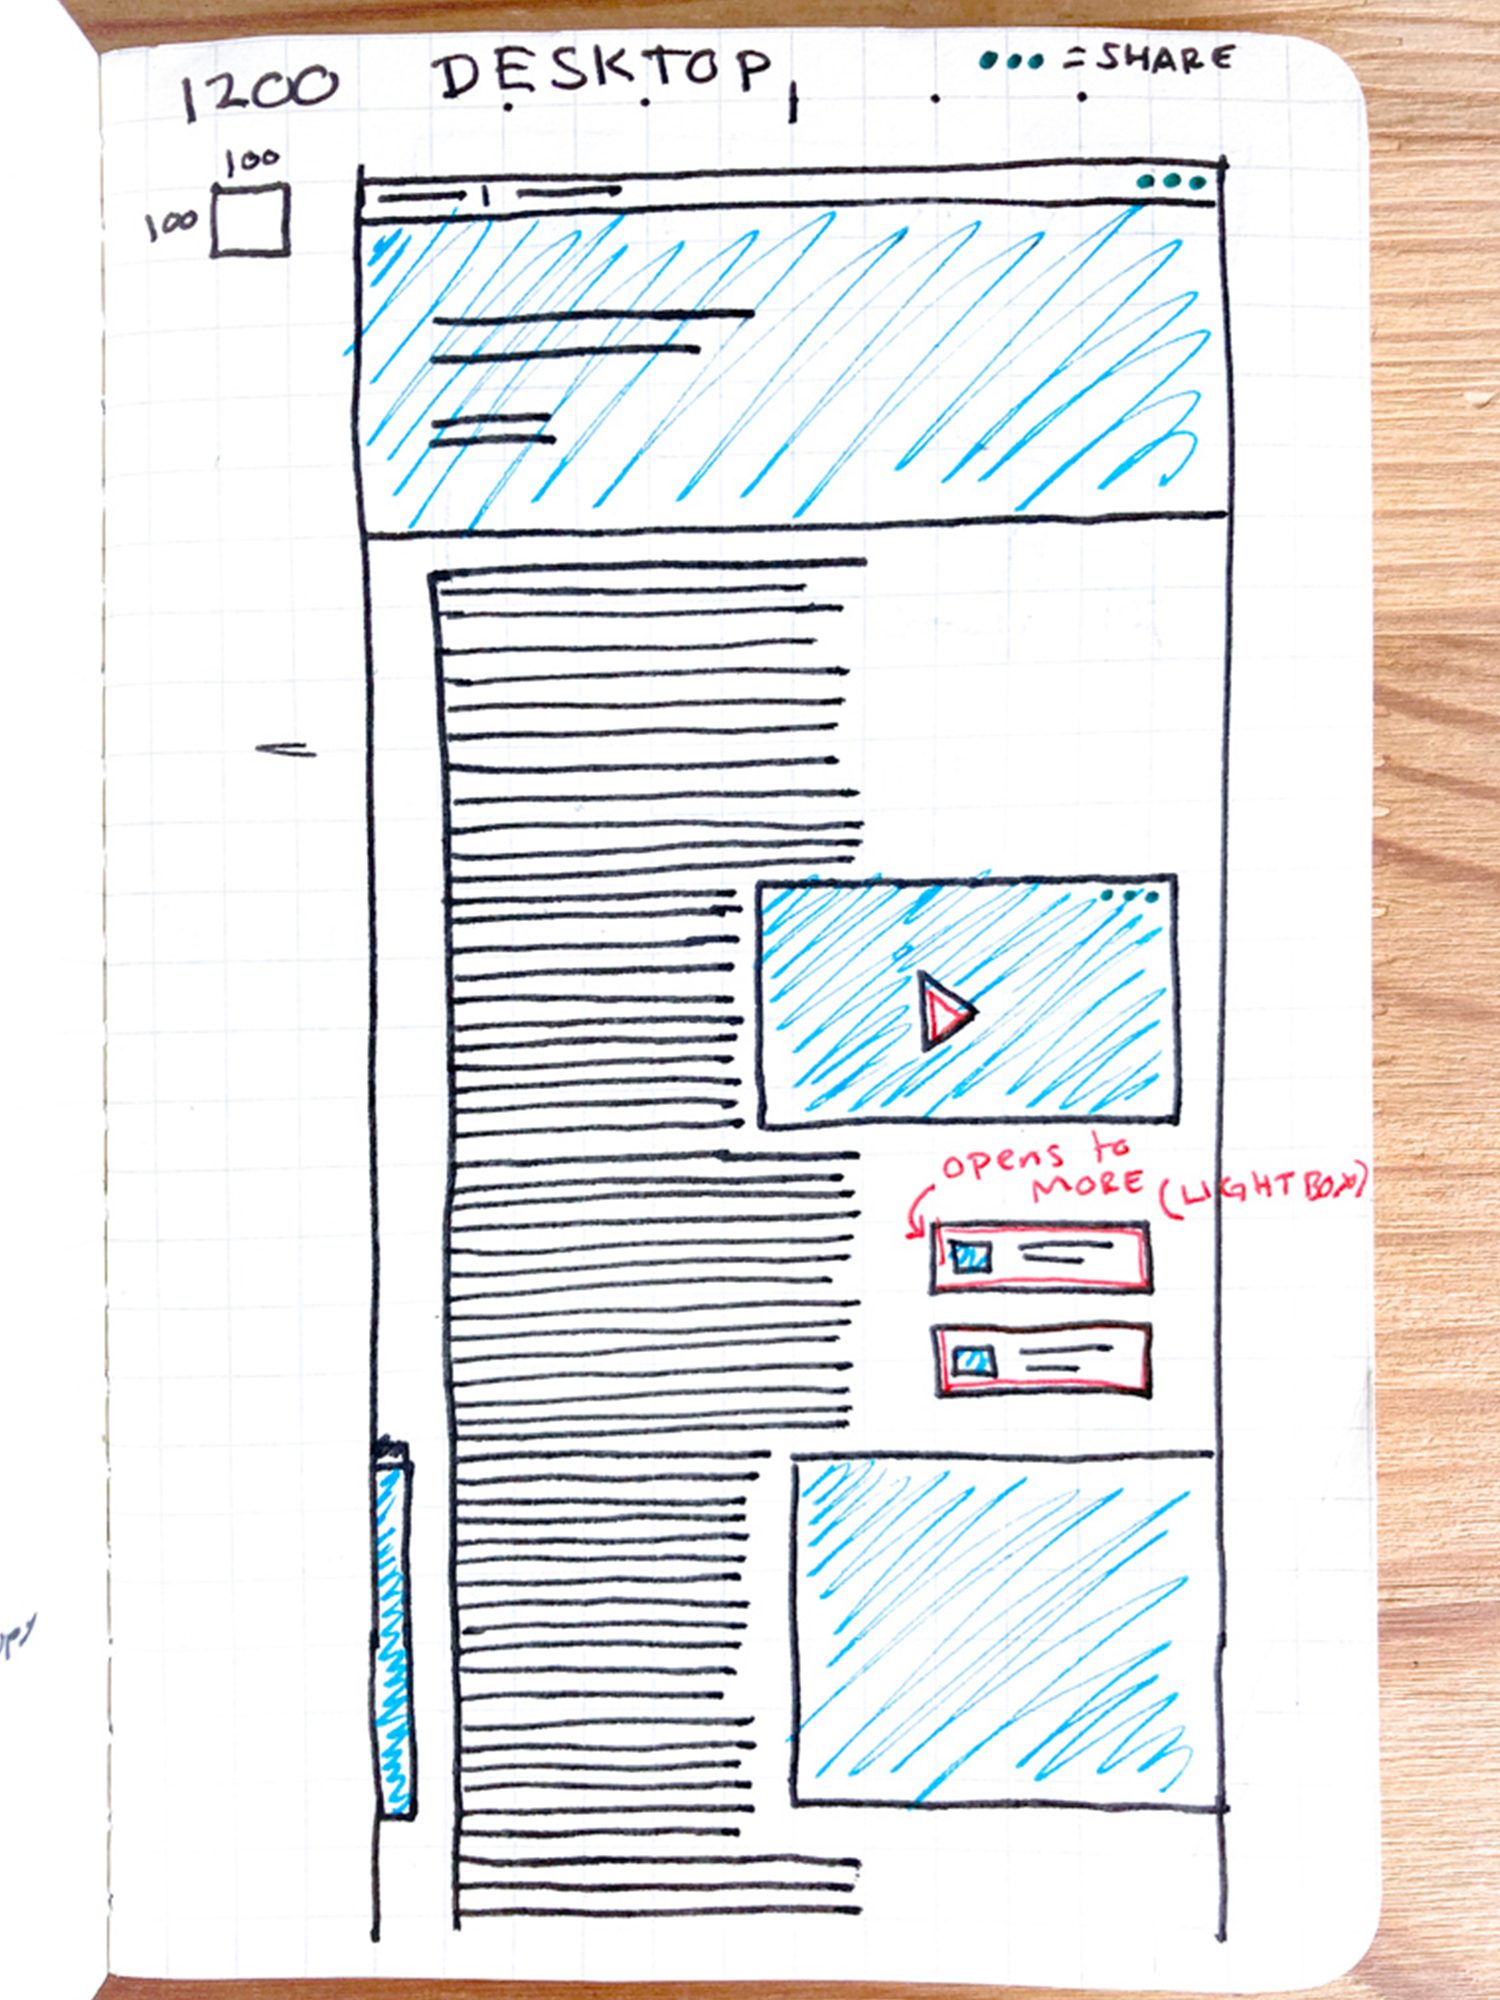
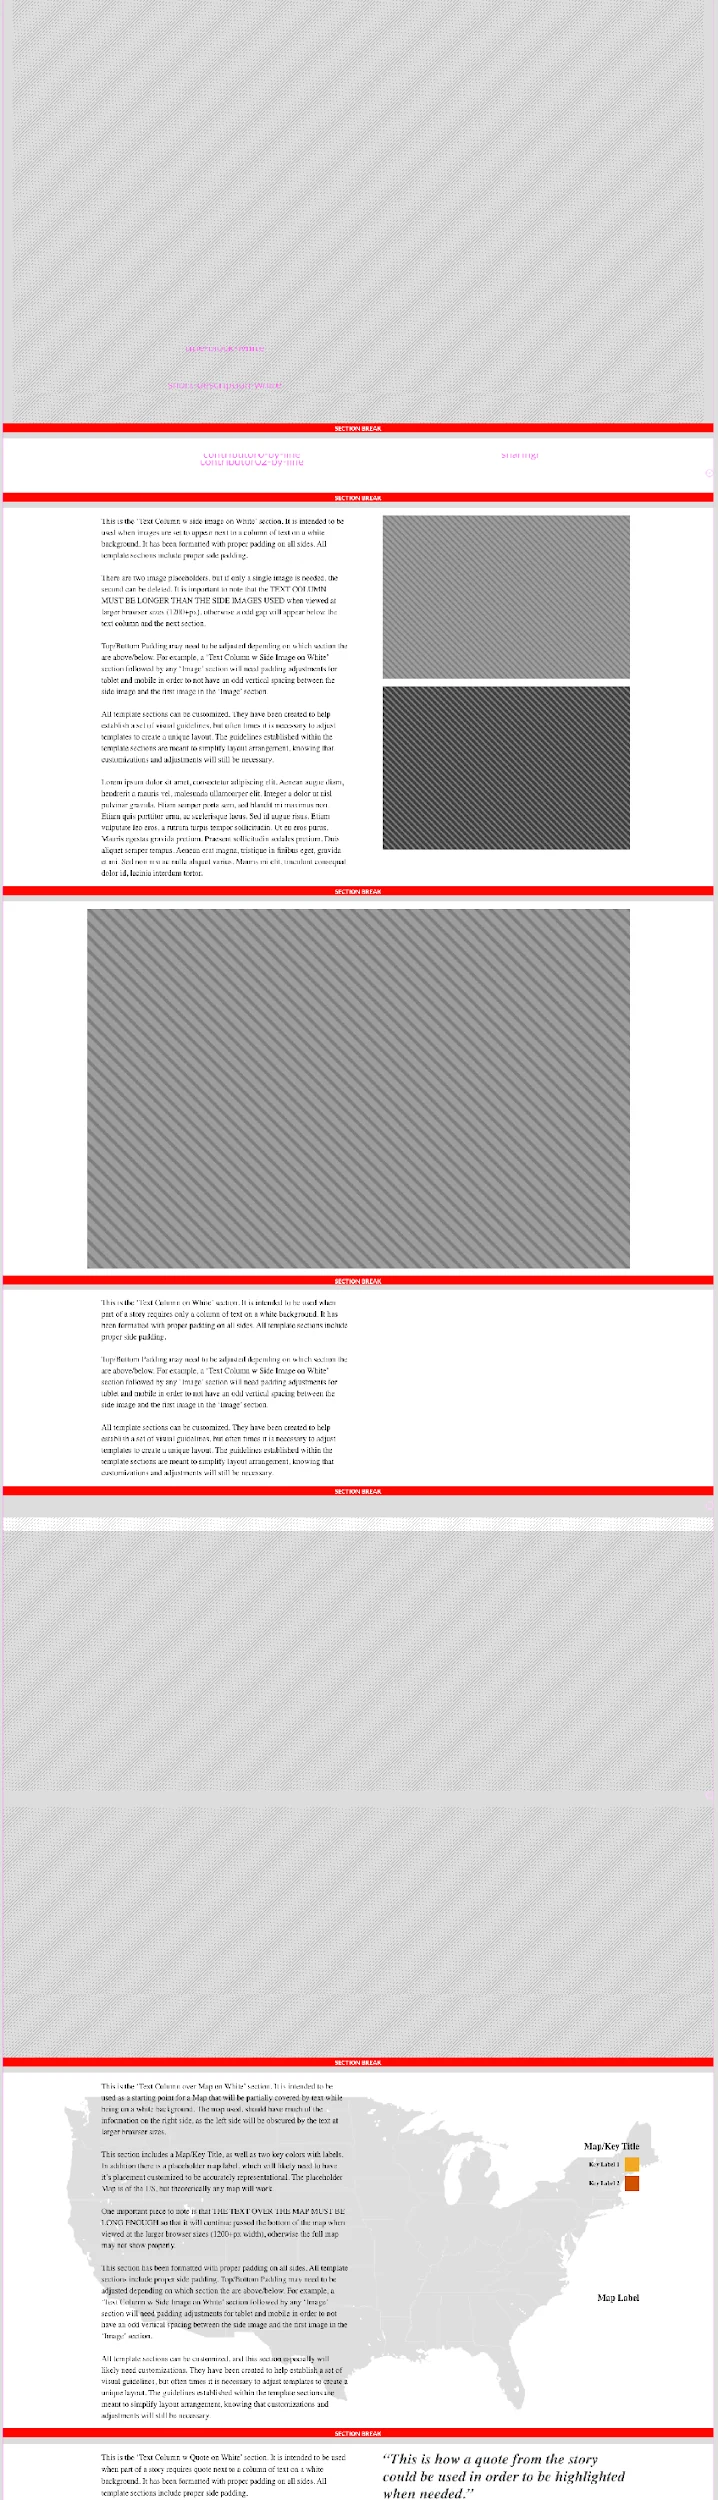
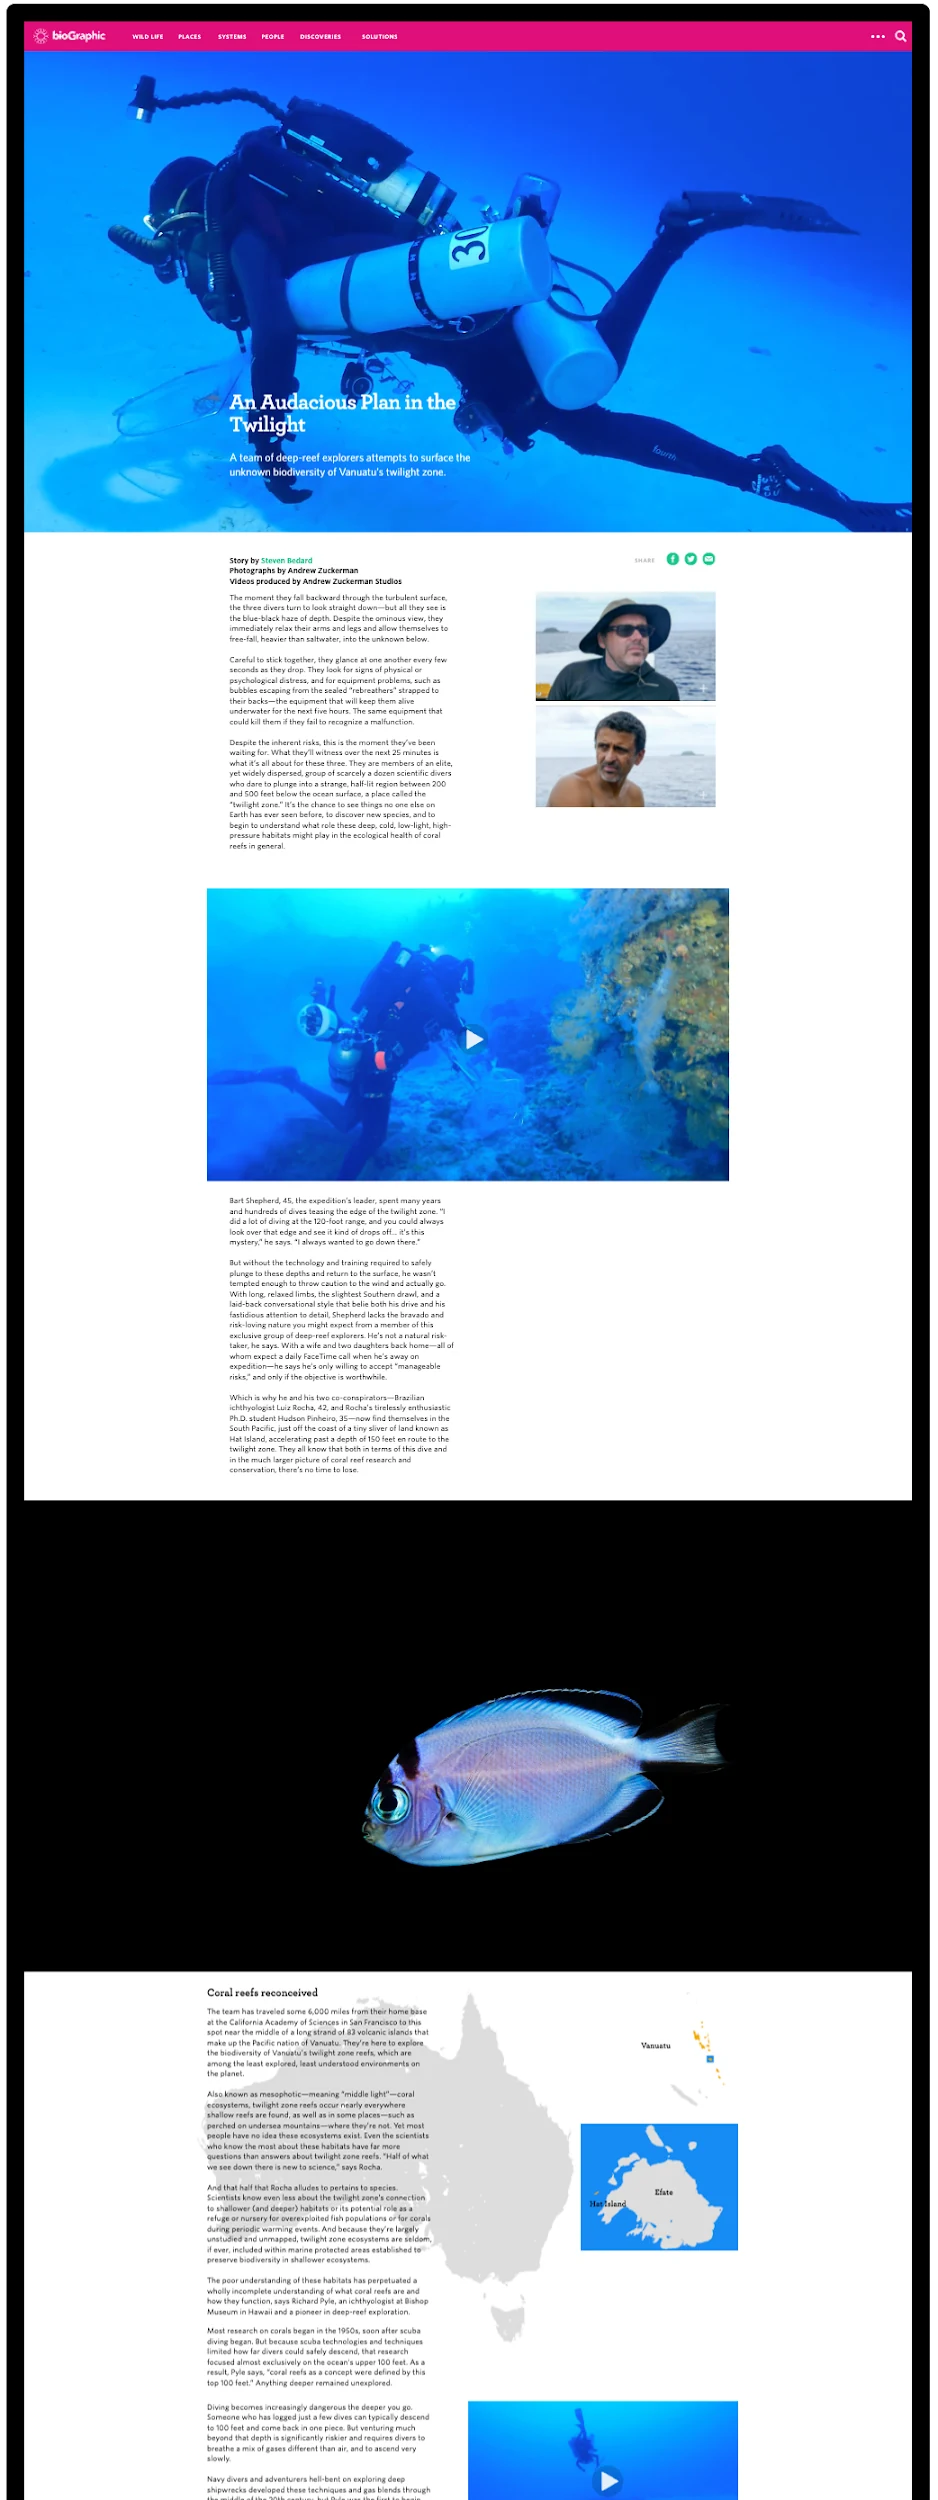
Templates, and the documentation that made them usable
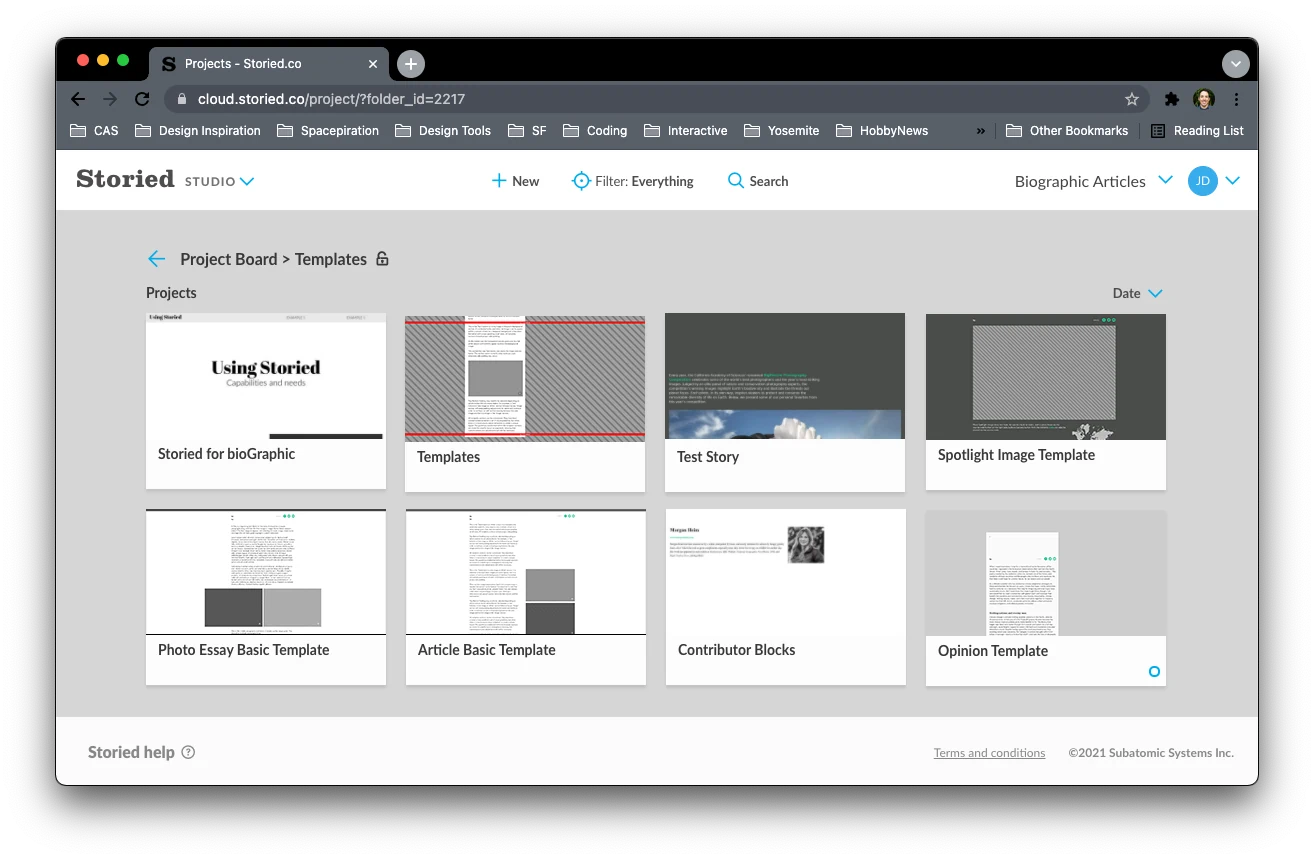
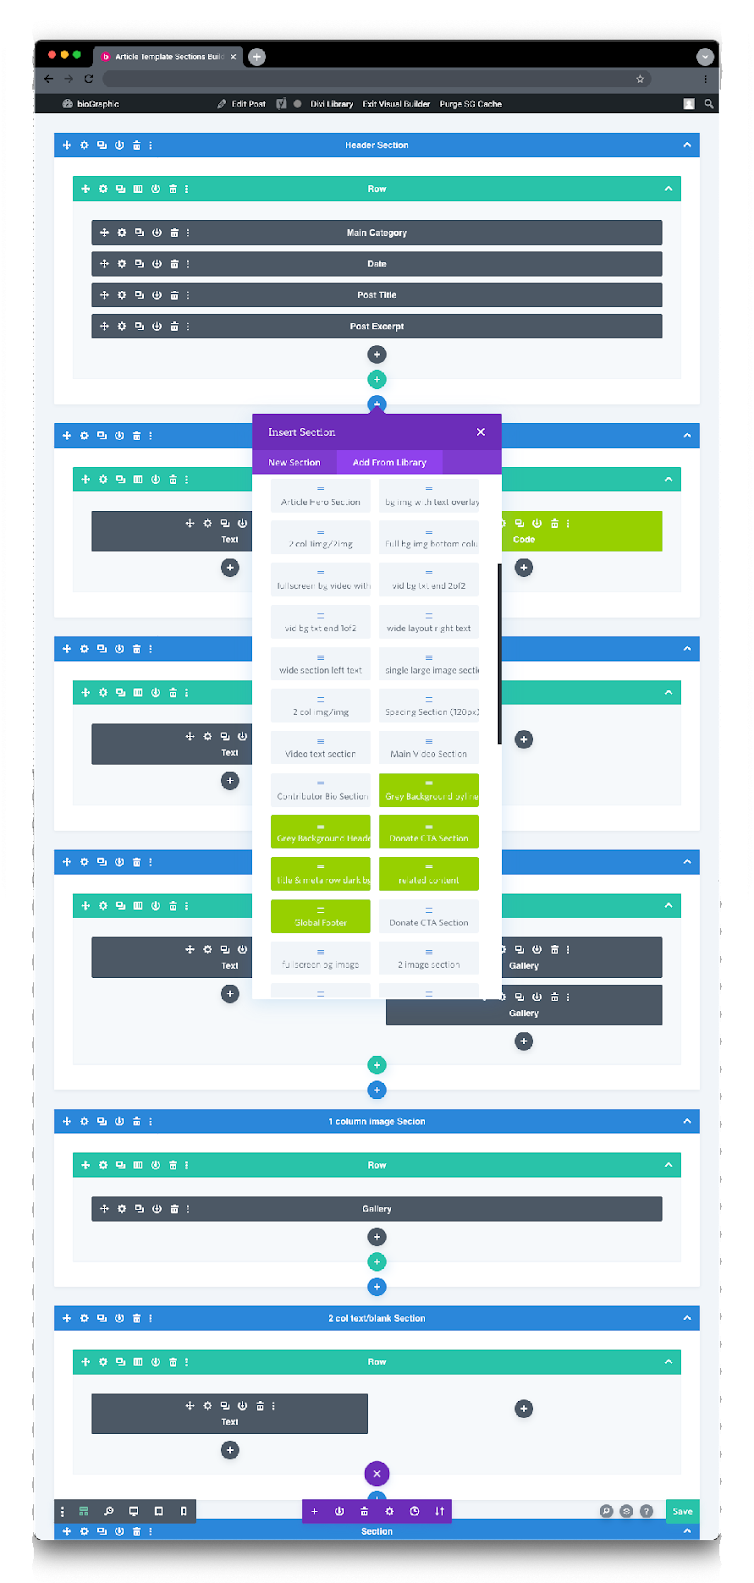
Modules alone left too many decisions open, so I built named templates on top of them, from Article Basic to Photo Essay and Opinion. The article set alone had fifteen named sections, each with a written note on when to use it. The documentation ended up being as important as the components. It told editors what was available, and also when and why to use each piece.
Readers didn't click, so scrolling became the interaction
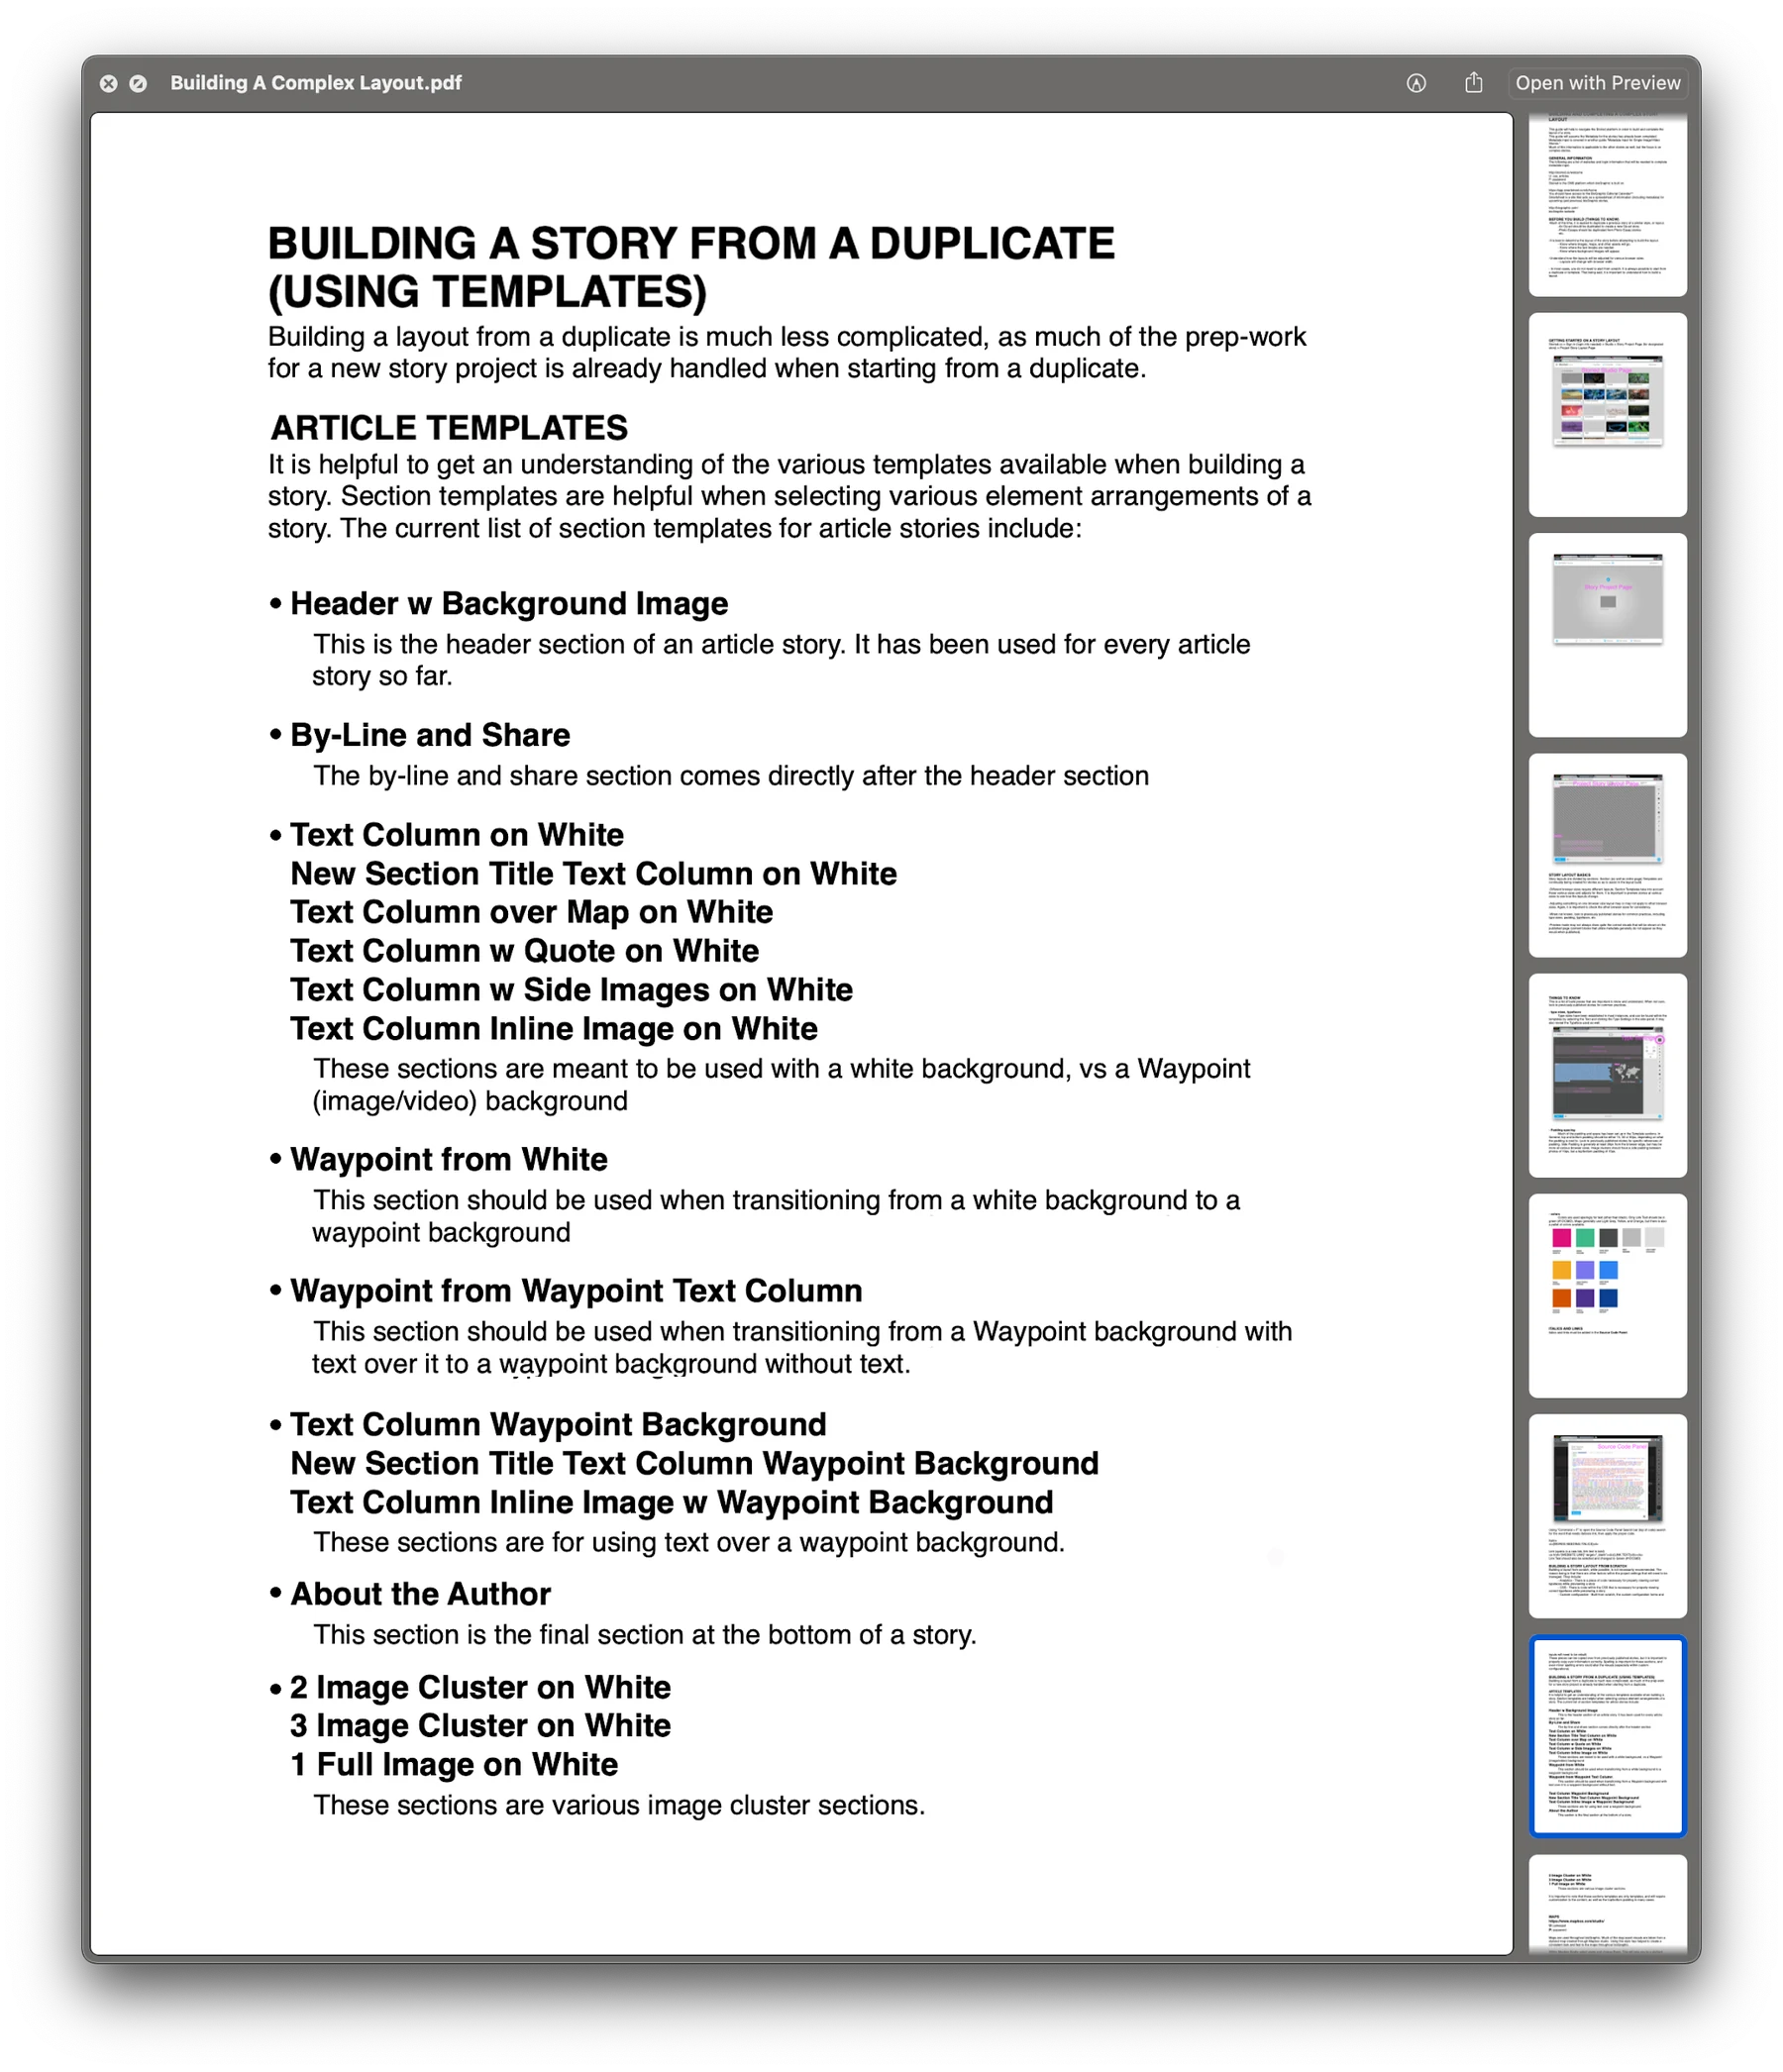
In testing, readers scrolled straight past anything that needed a press or hover, so I tied the reveals to scroll position instead.
I ran moderated testing over two rounds with readers recruited on the museum floor. We chose local visitors so they could come back, and five of them returned for the second round, which let me see whether each fix actually worked. Sessions were mostly open browsing, with a few prompts along the way. Two findings ended up changing the whole system.
Readers scrolled straight past the interactivity
- What I sawReaders moved through stories almost entirely by scrolling, so anything behind a press or hover went unnoticed.
- What I changedInstead of louder buttons, I built the interaction into the scroll: reveals tied to scroll position, and information shown directly where no interaction was needed.
- Round twoReaders noticed the reveals unprompted. Nobody needed to be told how it worked.
Donation and newsletter prompts were invisible
- What I sawReaders scrolled past a small donation section and never found the newsletter, even when asked to.
- What I changedBoth had been endnotes. I made them structural: donate moved into the main navigation, and newsletter signup into the footer.
- Round twoReaders found both without prompting.
A pattern every immersive story followed
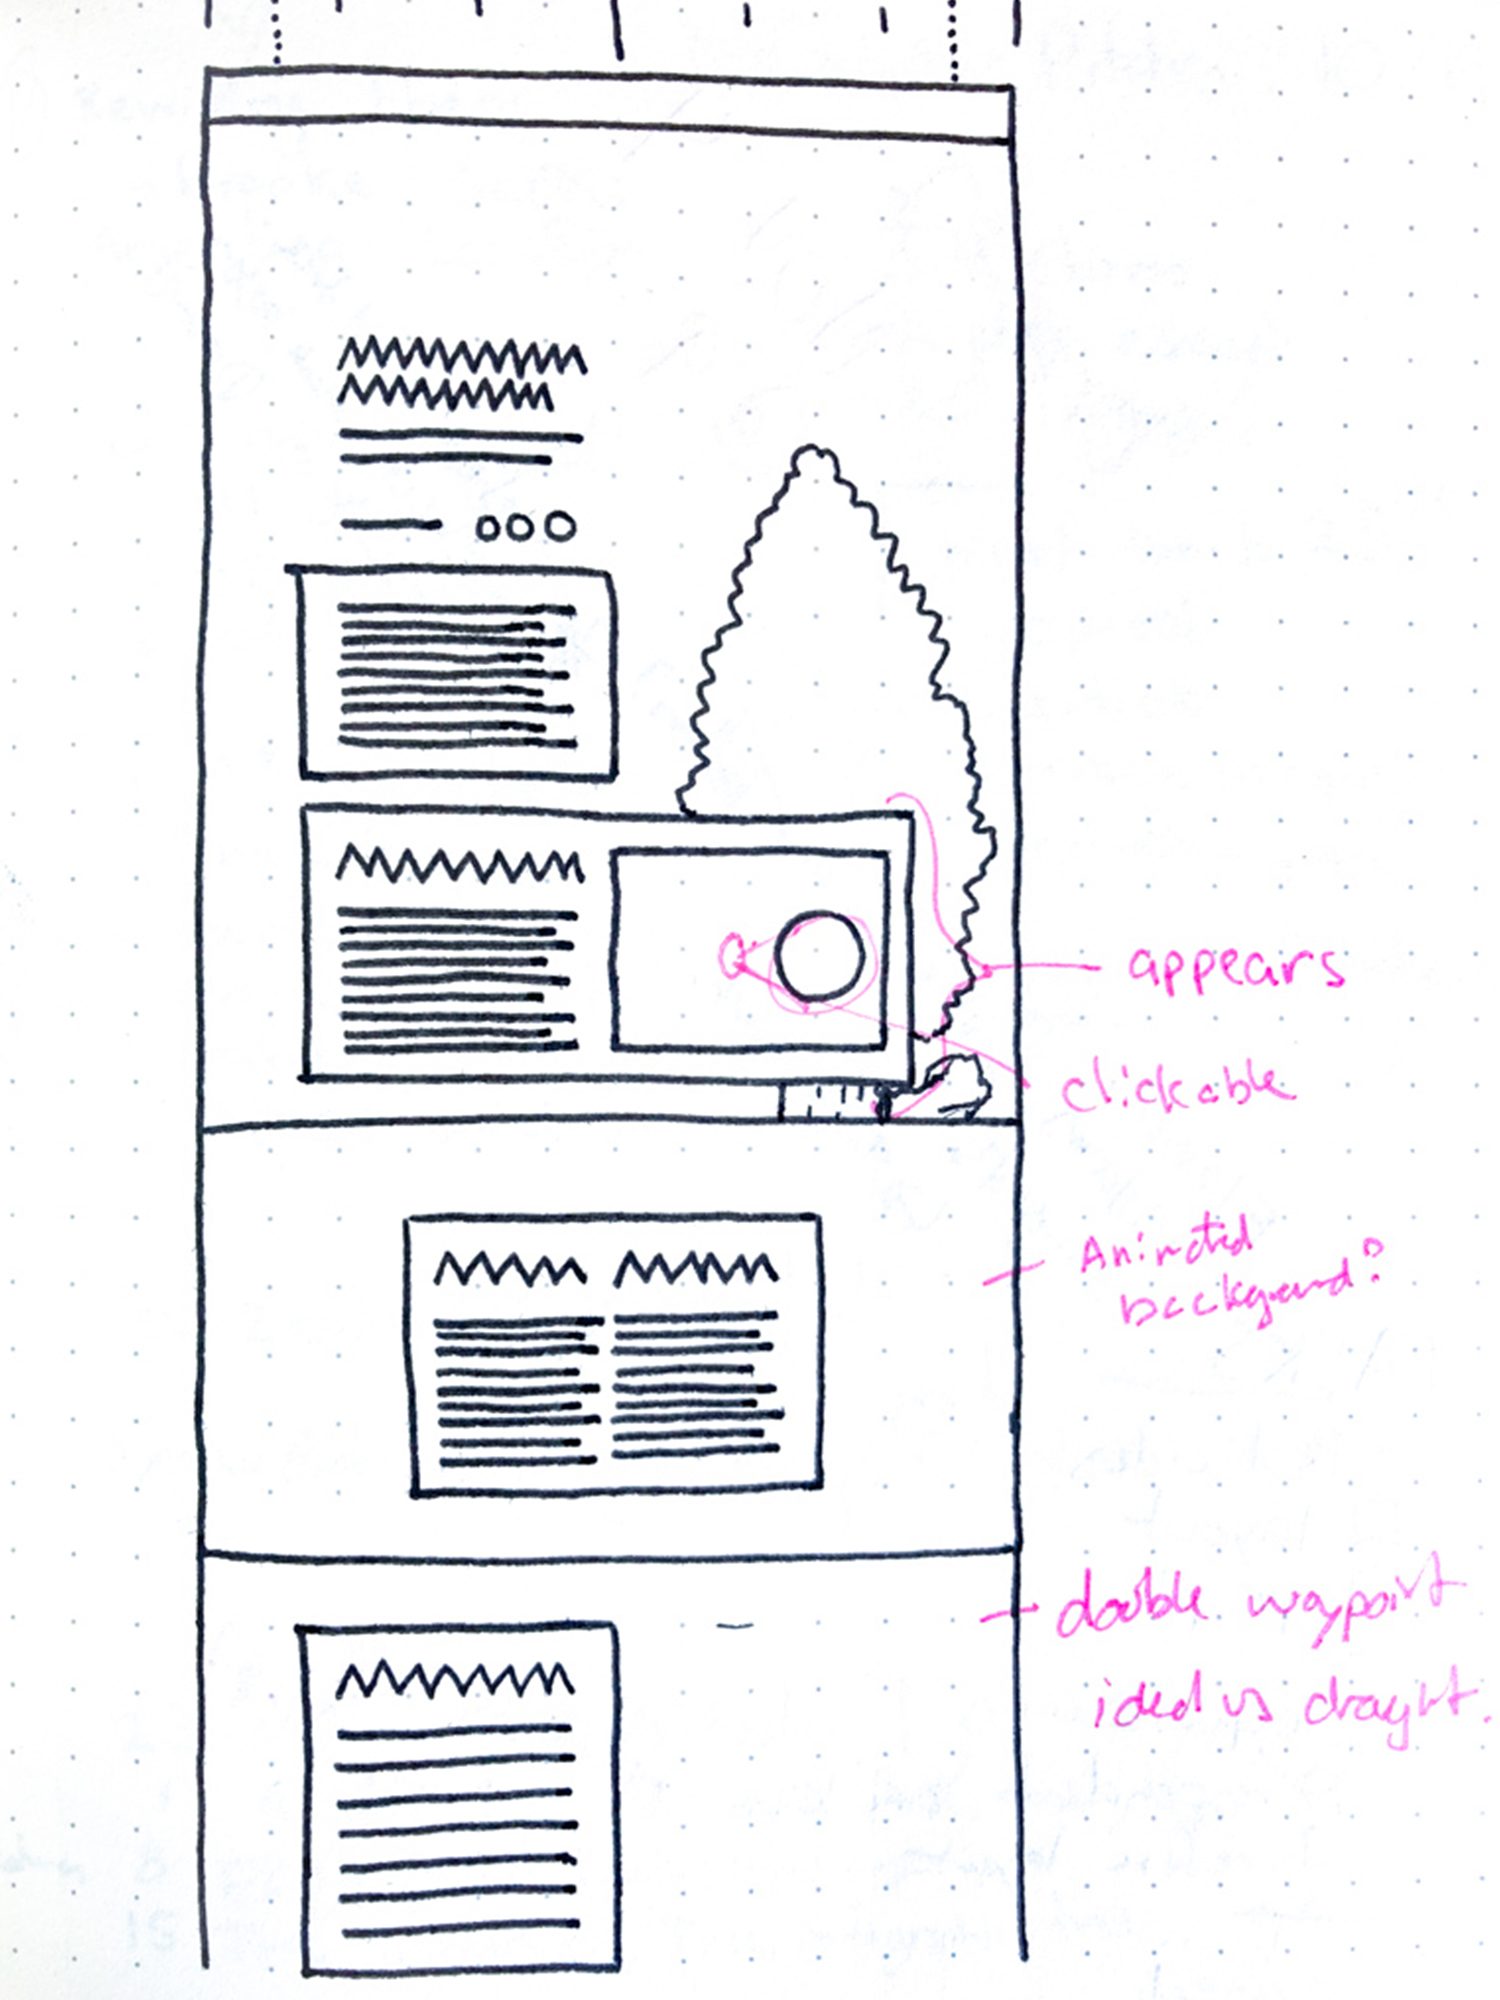
It confirmed a direction I'd sketched before any visual design, marking waypoints where full-bleed media takes over, and became the pattern every immersive story followed.
Building it, then rebuilding it
I built the first version in Storied, writing custom HTML and CSS where the builder stopped. For the 2018 move to WordPress, I rebuilt ten stories as templates, turned them into specs, and oversaw an external developer through the rest.
- Nearly 150stories to rebuild, several of them immersive
- 10rebuilt first, as proof of concept and templates
- About a thirdof the archive rebuilt by me
- Every storyoverseen, including those built from my specs
The first version, on Storied
I worked directly with Storied's engineers to add new components and capabilities, and led that work whenever an immersive story needed something the platform couldn't do yet. The catch was time. A new component from Storied meant waiting on their engineers, which could push back a story's publication date. When we couldn't wait, I built the element myself, with custom HTML and CSS alongside the platform's existing components. Building it myself also meant I could specify and document each section accurately for editors.
Accessibility. Responsive legibility was planned into the grid from the start, with elements sized in units so long stories stayed readable on small screens. Text over photography followed WCAG contrast guidelines, and story text stayed at 16pt or larger, dropping to 12pt only for captions and tags. I tested across desktop browsers, several tablets, and Apple and Android phones.
A rebuild, not a port
Every story had to be rebuilt for WordPress. The ten I rebuilt first became proof of concept and templates for each format, and their documentation became the specs our external developer worked from.
Specs someone else could follow
Because the specs came from stories I'd already built, they held up. I rebuilt about a third of the archive myself, reviewed the rest, and the new system ran for eight years.

From designer-led to editor-led
Every early story came through me. With named templates and written documentation, editors could build and publish on their own, and my role shifted to guidance and oversight.
A library editors could pick from
How editors actually used the templates shaped what came next. The 2018 rebuild added around two dozen named sections in a menu inside the CMS, from heroes and image clusters to full-screen video, galleries and donate blocks, the last straight from testing.
Editors publishing on their own
The clearest measure was who did the work. Story layout moved from me to the editorial team, and they kept publishing that way for years, long after I left the Academy in 2021. As new editors joined, I onboarded them and reviewed layouts in development, to keep the modules used consistently and correctly.
Outcome
- 600+
- stories on the same taxonomy, module library and templates by July 2026
- 1M+
- people reached annually, per bioGraphic's own reporting
- 8 yrs
- of the 2018 build in production
- 25+
- named sections for building every story, in a library that kept growing
For editors
Story layout went from designer-led to editor-led.
For readers
Information arrived through scrolling, and newsletter and donate were easy to find.
For the Academy
Donate and newsletter moved from endnotes into the navigation and footer, where readers in testing found them without prompting. For a publication funded by membership and philanthropy, that mattered.
The archive is the clearest sign it scaled: nearly 150 stories at the 2018 rebuild, close to 400 when I left in 2021, and more than 600 by July 2026, when bioGraphic became independent, all on the same taxonomy, modules and templates. Between 2018 and 2021 I kept extending it, helping build the more complex stories and adding new elements, or reusing earlier ones, wherever they made a story better.

Learnings and next steps
About design systems
A design system is only as useful as people's confidence in using it. Here, that confidence came from clear names and written notes as much as from the components.
About evidence
Testing taught me to design for the behavior I could observe, not the behavior I hoped for. Building the work myself showed me where my decisions held up.
What came next. bioGraphic became an independent publication in July 2026, and until then editors were still publishing on the system I built. At Stanford GSB I took the same approach to faculty websites, starting with a clear structure and adding templates and documentation so faculty and staff could keep their own sites current. If I started again, I'd test with editors as early as readers, and push sooner for components we could extend ourselves. What I'm most drawn to now is the same idea at a larger scale, making work that helps people learn something complicated, understand it and share it.